layout
options.layout controls the visual presentation of the pivot table: its title
bar, row density, grand-total placement, drill-through behaviour, and which axis
the measures sit on. None of these change the numbers — only how they are shown.
Concept
A pivot has two axes (rows and columns) built from your dimensions, and a set of
measures that fill the cells. layout decides:
- how tall each row is (
density), - whether grand totals appear and where (
totalsRowsPosition,totalsColumnsPosition), - whether the measures spread across columns or stack on rows (
measuresAxis), - and cosmetic touches like a title bar and zebra striping.
All examples below use the Sales 2025 dataset (Region, Category,
Product on rows; Quarter on columns; Sales (€) summed).
Quick reference
| Key | Type | Allowed / Default | Meaning |
|---|---|---|---|
showTitle | boolean | true | Render the title bar. |
title | string | "" | Title text. |
notes | string | "" | Footer note text. |
density | string | Compact | Standard | Comfortable | Row height. |
alternateRows | boolean | false | Zebra striping. |
enableDrillThrough | boolean | true | Allow data-cell drill-through. |
drillThroughStickyColumns | integer ≥ 0 | 2 | Left-pinned columns in the drill-through table. |
totalsRowsPosition | string | before | after | none | Grand-total row placement. |
totalsRowsSticky | boolean | false | Pin grand-total rows on scroll. |
totalsColumnsPosition | string | before | after | none | Grand-total column placement. |
totalsColumnsSticky | boolean | false | Pin grand-total columns on scroll. |
measuresAxis | string | rows | columns | Axis the measures sit on. |
Recipes
Comfortable density
Increase row height for easier scanning of dense tables.
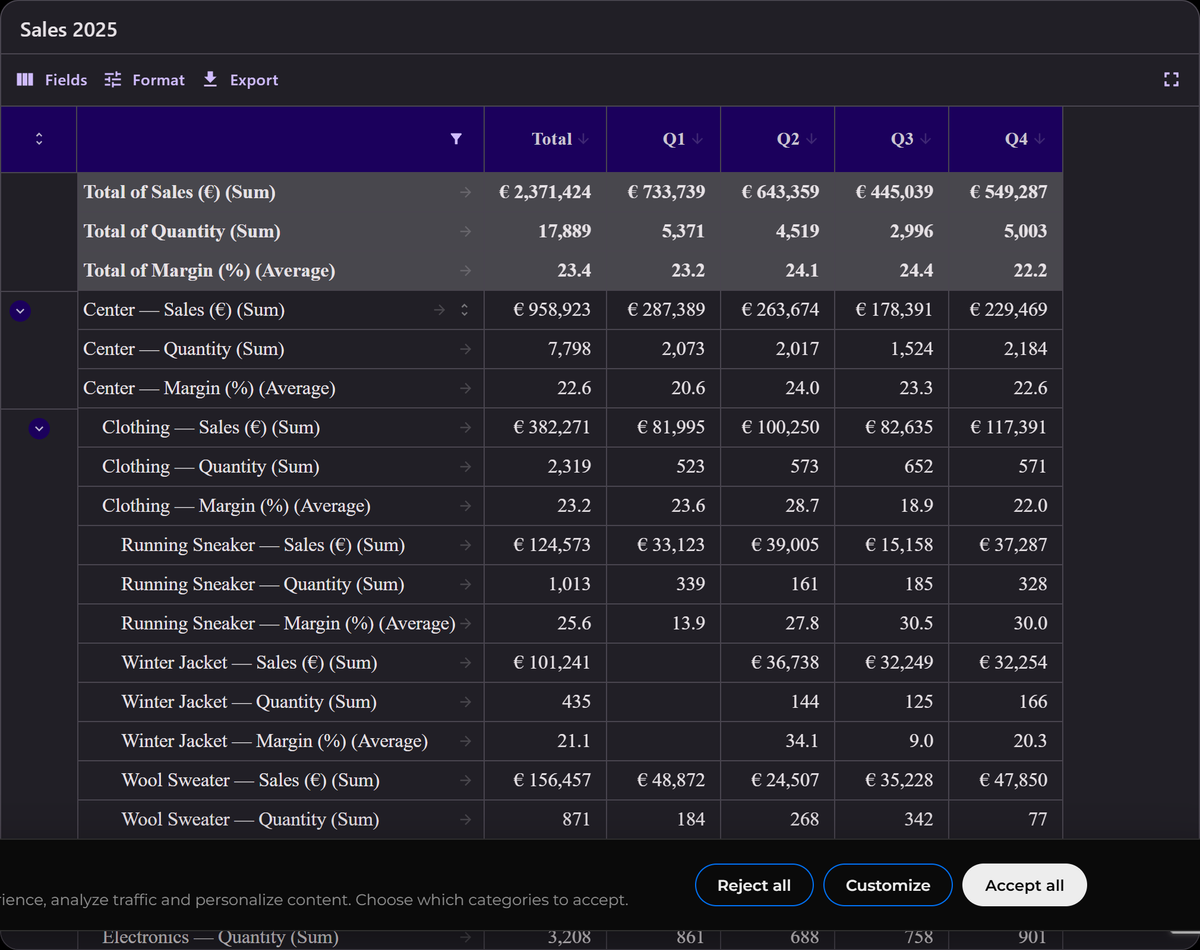
const options = {
  layout: { density: "Comfortable" },
};
Move grand totals to the bottom
By default the grand-total row sits before the data. Set totalsRowsPosition to
after to push it to the bottom, or none to hide it.
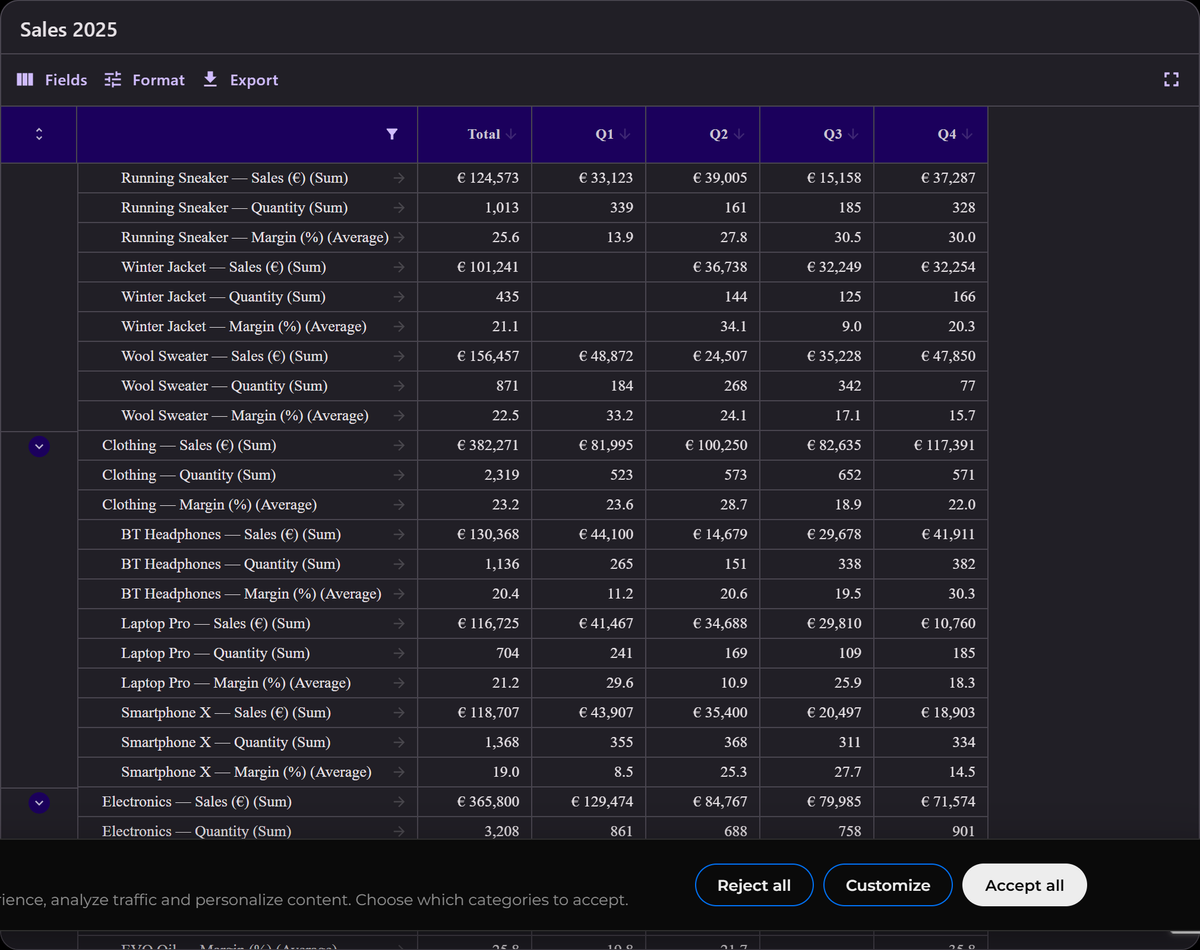
const options = {
  layout: { totalsRowsPosition: "after" },
};
Zebra striping
Alternate row backgrounds to make wide tables easier to read across.
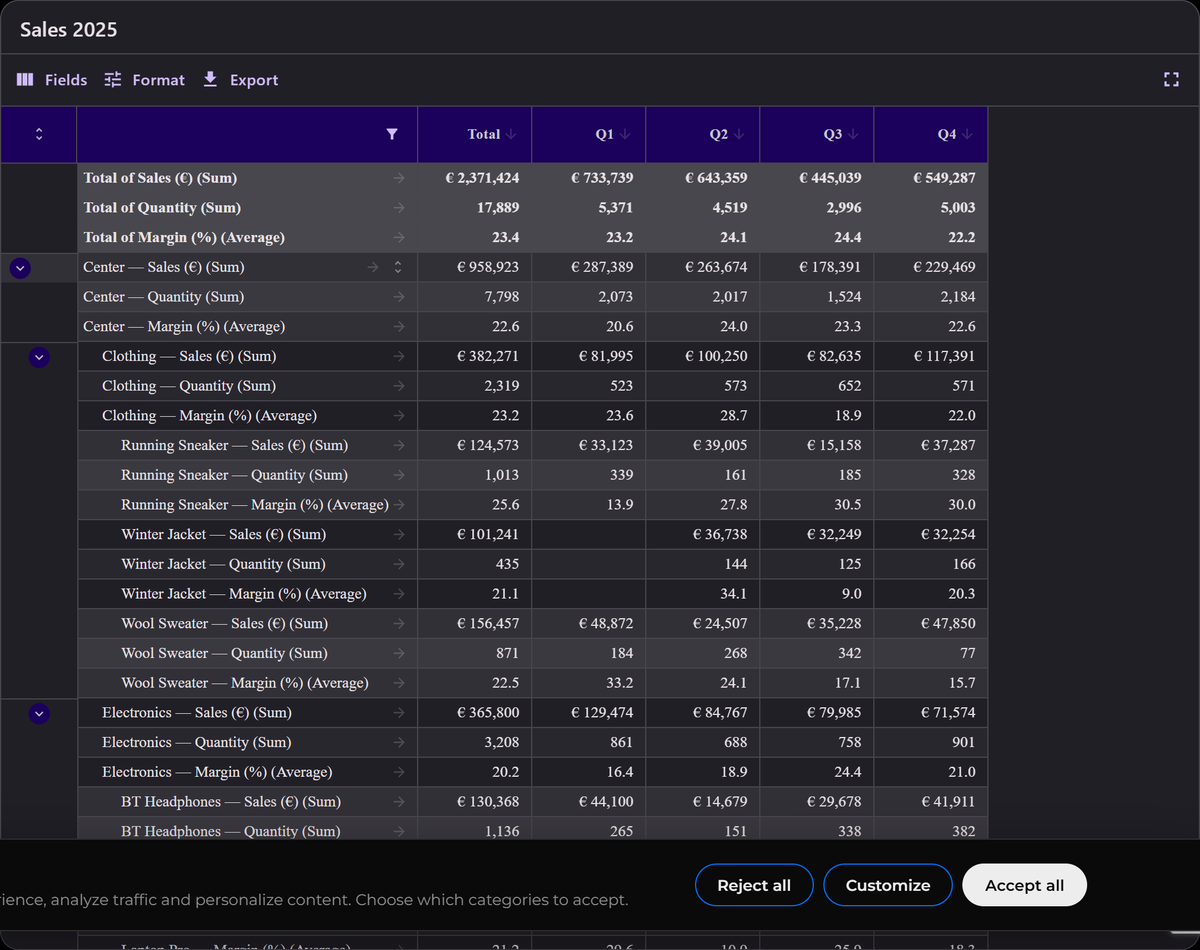
const options = {
  layout: { alternateRows: true },
};
Spread measures across columns
measuresAxis decides whether measures stack on the row axis or spread across
the column axis. With two measures on the column axis, each Quarter shows its
Sales (€) and Quantity side by side.
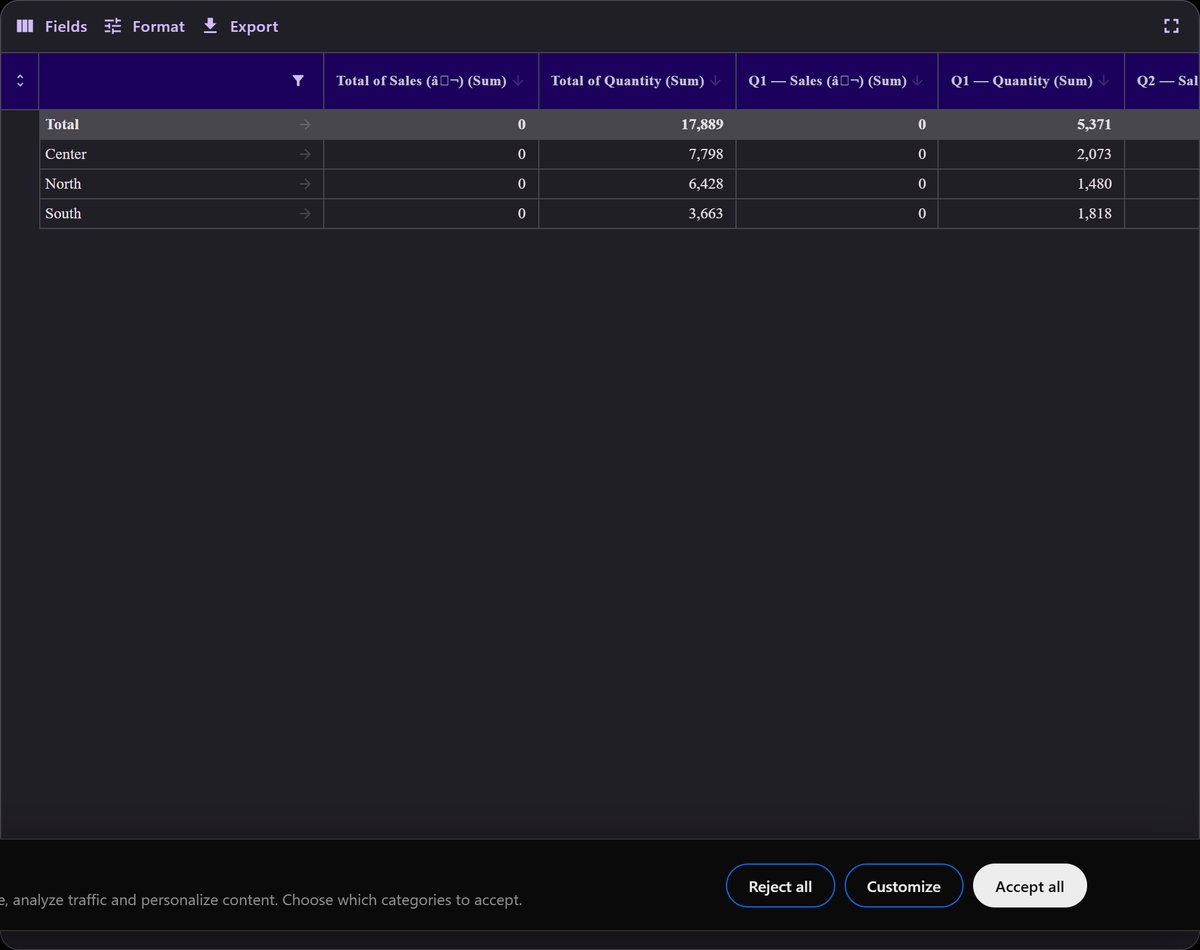
const options = {
  layout: { measuresAxis: "columns" },
};
The reserved Measures pseudo-field is placed on whichever axis you choose, so
measuresAxis interacts with data.dimensions. See data.measures.